

What Is Google’s INP Score, and How Can I Improve It?
Posted: August 13, 2024 | Updated:
The success of online businesses often depends on converting website visitors into paying customers. Therefore, their websites must perform well without issues. As competition intensifies, monitoring website performance becomes crucial to prevent user disengagement. In response, Google has updated its core web vitals to include the INP score (Interaction to Next Paint), a new performance metric for website optimization. This blog will explore INP and its components in detail.
What Is Google INP Score?
Google’s INP score measures a page’s responsiveness to user inputs by tracking the delay of various interactions during a user session, such as clicks, taps, and keyboard inputs. It is a new metric from Google Core Web Vitals that evaluates the delays in user interactions on your website, replacing FID (First Input Delay).
The INP test quantifies when a user acts on your website, such as clicking a button, to when the visual response, termed ‘next paint,’ is displayed. This includes submitting a form, clicking a button, or selecting an image that appears in a lightbox. The test records how long it takes from these user actions to the visible update on the screen. It explicitly captures the duration of the most extended interaction, excluding extreme values.
Google then generates a single INP score reflecting the duration of most interactions on your site. Based on the speed of visual updates, this score categorizes your website’s responsiveness as ‘Good’, ‘Needs Improvement’, or ‘Poor’.
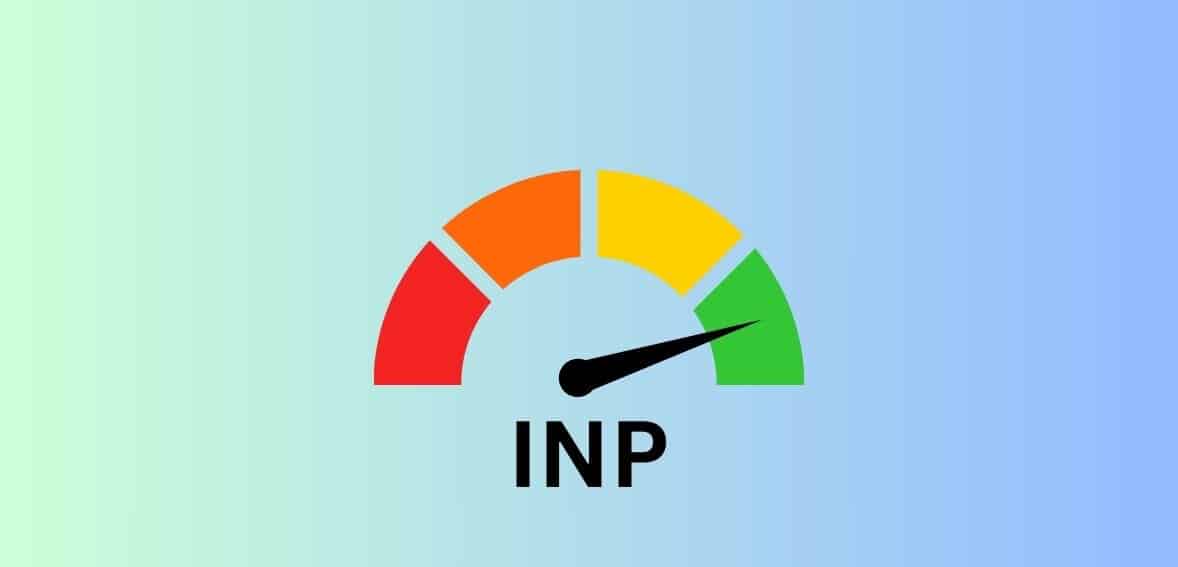
What Is a Good INP Score?

Google defines a satisfactory INP value as approximately 200 milliseconds or lower. The current thresholds for evaluating INP are as follows:
- Two hundred milliseconds or less: This is considered good responsiveness, indicating that the website reacts swiftly to user interactions.
- Between 200 and 500 milliseconds: This range is deemed moderate and indicative that responsiveness needs enhancement to improve user experience.
- Above 500 milliseconds: Responsiveness at this level is rated as poor, suggesting significant delays that could affect user satisfaction and engagement.
It’s important to note that INP is an experimental metric, and Google may update its guidelines and thresholds as more data becomes available and the understanding of user interaction improves.
Key Components of INP
Three primary factors affect interaction latency:
- Input Delay: When the system starts processing that input, a user initiates an interaction with the page. It accounts for delays introduced by the input device (like a keyboard, mouse, or touchscreen) and the system’s initial processing.
- Processing Time: After receiving user input, the system processes this information to determine the necessary response. Processing time includes the system’s period to interpret the input, perform any required computations or operations, and prepare the response.
- Presentation Delay: Once the response is ready, it may be delayed before it is displayed to the user. Presentation delay covers the time required for the system to update the display and render the necessary graphics or user interfaces.
Addressing these components effectively can enhance the user experience and improve INP scores.
How Is INP Calculated?

Google anonymously collects INP data from Chrome browsers, focusing on a sample of the longest single interactions that occur during a user’s visit to a page. As outlined in the previous section, each interaction consists of several phases (Input Delay, Processing Time, and Presentation Delay).
As mentioned, INP is determined by monitoring all user interactions on a page. Typically, most websites record the interaction with the longest delay as the INP.
However, occasional glitches on pages with numerous interactions may lead to a single high-latency interaction, skewing the perceived responsiveness of an otherwise efficient page. The likelihood of such anomalies increases with the number of interactions on the page.
To reflect a page’s responsiveness more accurately when it has many interactions, the worst latency is disregarded for every set of 50 interactions. This adjustment mainly affects pages with fewer than 50 interactions, where the longest delay is usually recorded. Additionally, the 75th percentile from all page views reports INP, further filtering out extreme cases and providing a metric representative of most user experiences.
When a user exits the page, these performance metrics are transmitted to the Chrome User Experience Report, or CrUX, which compiles the data to offer insights into actual user experiences, referred to as field data.
Why Was INP Introduced to Replace FID?
Google decided to replace the FID with INP due to its limitations, which were well-recognized in the SEO community. INP represents an advancement in measuring a site’s responsiveness more thoroughly. Consequently, FID will no longer appear in your Google Search Console reports. Site owners should continue prioritizing user experience improvements as they have traditionally done.
While Core Web Vitals are only a part of a website’s SEO strategy, focusing on these metrics is crucial as they significantly impact user engagement and conversion rates. Sites optimized for speed and responsiveness tend to perform better than those with inferior user experiences.
Identifying Causes of INP Delays
If your website shows warnings about Interaction to Next Paint (INP) with delays exceeding 200ms, it’s important to identify the causes and address them effectively. Below are the main contributors to such delays:
- Long Tasks on the Main Thread
Every browser operation, whether rendering or executing JavaScript, involves tasks. The main thread manages these tasks, but it can only handle one at a time. Tasks that take longer than 50 milliseconds are categorized as long tasks, and they can hinder the browser’s ability to respond quickly to user inputs, thereby increasing INP times.
- Large DOM Size
The Document Object Model (DOM) is the structural representation of your HTML document. A larger DOM can impede the efficiency of a page’s rendering and updates. Keeping the DOM size below 1,400 nodes, as recommended by tools like Lighthouse, is crucial for optimal performance.
- Client-Side Rendering
In contrast to server-side rendering, which involves the server delivering HTML content in segments that allow the browser to start rendering immediately, client-side rendering sends minimal HTML initially. It relies heavily on JavaScript to dynamically generate content. This process can lead to extensive JavaScript execution on the client’s machine, potentially causing long tasks that block the main thread and negatively impact INP scores.
Concentrate on identifying and reducing these issues to enhance your INP score. By tackling the specific causes of delays, you can significantly improve the responsiveness of user interactions on your site.
Common Ways to Measure INP Performance

To pinpoint which areas of your website need enhancement, examine the Core Web Vitals report available in Google Search Console. This tool identifies URLs that are performing poorly.
Consider these four ways to measure slow interactions on your site:
1. Utilizing INP Debugger by DebugBear:
DebugBear offers a free tool that automatically identifies slow interactions on your site by testing buttons, input fields, and other interactive elements. When a slow interaction is detected, the tool shows the affected UI component and its INP measurement. This tool is useful for straightforward issues but may not handle complex interaction patterns, such as those involving multiple steps or extensive user actions.
2. Manual Testing with Chrome DevTools
Chrome DevTools provides a method to analyze interactions manually:
- Open DevTools and go to the “Performance” tab.
- Begin recording an interaction.
- End the recording post-interaction.
- Examine the performance profile to identify CPU tasks and processes hindering rendering.
This approach offers detailed insights and effectively analyzes simple and complex interactions.
3. Creating User Flows in Lighthouse:
Lighthouse, integrated within Chrome DevTools, allows you to evaluate interaction delays manually or through scripted tests. This method facilitates repeated testing and can uncover more precise issues than broader performance evaluations.
4. Implementing Real User Monitoring (RUM):
RUM collects data from user interactions, providing insights into which components delay interactions. RUM tools also offer insights into particular instances of slow user experiences. This information can help pinpoint the exact circumstances of the delay, making it simpler to reproduce and resolve the problem.
This method is precious as it reflects genuine user experiences and can reveal problems under specific conditions, such as on different devices or browsers.
5. Web Vitals Chrome Extension
The Web Vitals Chrome Extension simplifies measuring your site’s interaction latency. To effectively use this tool, follow these steps:
- In Chrome, select the extension’s icon on the address bar’s right.
- From the drop-down menu, find and click on the Web Vitals extension.
- Once opened, navigate to the extension’s settings by clicking on the icon at the right.
- Select ‘Options.’
- Activate the ‘Console logging’ feature in the options menu and save your settings.
- Open Chrome DevTools and access the console to start your tests. This setup will generate detailed console logs, offering diagnostic insights into your site’s interactions.
6. Using PageSpeed Insights tool
To check your Google Core Web Vitals score, including the INP score, use the PageSpeed Insights tool. Here’s how to do it:
- Visit the PageSpeed Insights tool online.
- Enter the page URL you want to evaluate in the provided field.
- Click the ‘Analyze’ button to start the analysis.
The tool will take a few seconds to process, and then your web page analysis results will be displayed. The results will include the INP score, among other Core Web Vitals, with separate assessments for mobile and desktop versions.
After identifying areas of delay, work with your development team or website service provider to address these issues. Potential solutions may include optimizing external scripts, improving UI component performance, or other targeted technical adjustments depending on the identified problems.
How to Optimize Your INP Performance?

Before implementing optimization strategies, it’s essential to identify what’s causing your INP to lag. Tools like the Chrome UX Report and Google Analytics can help you pinpoint pages or interactions with high INP scores, allowing you to focus your optimization efforts where they are most needed.
After identifying pages with high INP, you can use Google’s DevTools to locate specific JavaScript code or processes clogging the browser’s main thread. This thread acts like a highway for user interactions; lengthy tasks here can directly affect INP.
Having pinpointed the bottlenecks, you can now begin optimization. Here are effective ways to enhance your INP scores:
1. Reduce CPU Load on the Main Thread
The main thread is critical as it handles the primary functionalities that make a webpage interactive. It operates on a single-task basis, meaning concurrent tasks can cause delays in user interactions and screen updates, thus affecting INP.
To prevent overloading the main thread:
- Implement code-splitting and lazy-loading to manage resource loading better, enhancing initial load times and user interaction responsiveness.
- Use web workers for heavy tasks that don’t involve DOM manipulation, allowing these processes to run independently of the main thread.
2. Minimize Layout Thrashing and Reflow
Layout thrashing happens when the browser frequently recalculates the positions and sizes of elements, which can degrade performance. To address this:
Bundle layout changes to occur in one reflow, reducing the number of recalculations required.
Avoid JavaScript operations that trigger reflows, such as repeatedly accessing element dimensions. Instead, use less disruptive methods like getBoundingClientRect().
3. Enhance Processing Speed
Focus on streamlining the most resource-intensive browser processes. For instance, in frameworks like React, ensure components do not re-render unnecessarily. Reduce the load from layout and repaint processes.
4. Additional Optimization Techniques
- Segment Main Thread Tasks: Reduce workload on the main thread to decrease input delays.
- Optimize Third-Party Scripts: Modify or load third-party scripts conditionally to minimize their impact on performance.
- Prioritize UI Updates: Use visual indicators like spinners during heavy processes and employ web workers for intensive JavaScript tasks to keep the main thread clear.
- Implement Non-Blocking UIs: Replace blocking alerts and prompt dialogs with asynchronous UI components.
Finally, Monitor performance regularly with tools like Google PageSpeed Insights, Lighthouse, and real user monitoring. Stay informed about the latest updates in core web vitals and adjust your strategies accordingly.
Conclusion
Optimizing your website’s INP score is crucial for maintaining a responsive user experience, directly impacting engagement and conversion rates. As Google’s new metric for evaluating website responsiveness, INP provides a more comprehensive measure than its predecessor, FID. To improve your INP score, focus on reducing delays in input processing, minimizing long tasks on the main thread, and optimizing client-side rendering.
Utilizing tools like Chrome DevTools, Lighthouse, and PageSpeed Insights can help identify and address the underlying latency causes. Regular monitoring and targeted adjustments will ensure your site remains competitive and user-friendly.